![]()
| Prev | Advanced Operations Guide | Next |
Monitoring MicroKernel Resources
This section describes the following options for monitoring the MicroKernel:
- Setting Screen Refresh Options
- Viewing Active Files
- Viewing User Information
- Viewing MicroKernel Resource Usage
- Viewing MicroKernel Communications Statistics
Setting Screen Refresh Options
You can refresh the information in the Monitor utility dialog boxes either automatically or manually, as follows.
- Automatically: select the Automatic Refresh check box. The utility updates the dialog boxes at the Refresh Rate specified in the Monitor options (available via Settings on the Options menu).
- Manually: Click Refresh.
Viewing Active Files
To view active MicroKernel files
- Choose Active Files from the MicroKernel menu. The MicroKernel Active Files dialog box appears, as shown in Figure 11-4 . This dialog box shows all the active files for the MicroKernel.
Figure 11-4 MicroKernel Active Files Dialog Box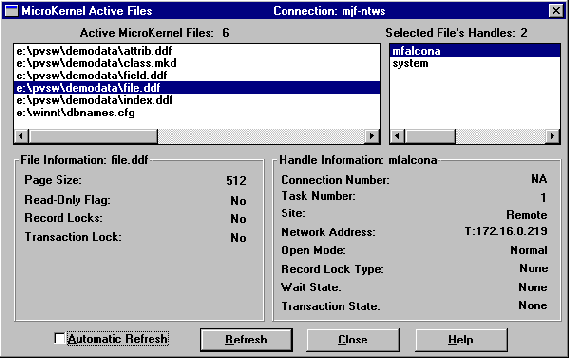
In the upper left of the dialog box, the Monitor utility displays the Active MicroKernel Files list. This scrollable list contains the complete path of all open files in alphabetic order.
In the upper right of the MicroKernel Active Files dialog box, the Monitor utility displays the Selected File's Handles list. This scrollable list contains the active handles (users) associated with the selected file. Each handle is represented by a user name (typically the login ID of the user), or by an index into the engine's client (user) list.
Some handles have an agent identifier, a two letter code that specifies the application that initiated the session.
Table 11-1 lists the agent IDs used by Pervasive.SQL components.
The File Information box displays detailed information about the selected file. The Handle Information box displays detailed information about the selected handle.
File Information
The File Information box displays the following information about each file:
Handle Information
The Handle Information box displays the following information about each file:
Viewing User Information
You can view a list of current users and files, as well as file handles for each user.
- Choose Active Users on the MicroKernel menu. The MicroKernel Active Users dialog box appears, as shown in Figure 11-5.
Figure 11-5 MicroKernel Active Users Dialog Box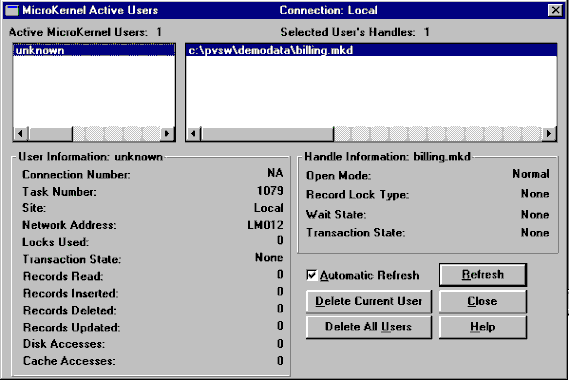
In the upper left of the dialog box, the Monitor utility displays the Active MicroKernel Users list. This scrollable list contains the names of active users in alphabetic order. Each user is represented by a user name (typically the login ID of the user) or by an index into the engine's client (user) list.
Each client is represented by either a user name (typically the login ID of the user) or an index into the engine's client (user) list. Table 11-1 lists the agent IDs used by Pervasive.SQL components. SeeUser Information for specific details about the information available.
In the upper right of the MicroKernel Active Users dialog box, the Monitor utility displays the Selected User's Handles list. This scrollable list contains the active handles (files) associated with the selected user. The MicroKernel creates a handle each time a user opens a file; therefore, a single user can have several handles for the same file.
- Highlight the desired handle in the list. SeeHandle Information for specific details about the information available.
User Information
The User Information box displays the following detailed information for the selected user handle:
Handle Information
When you click on a specific file handle, the following information about that handle is displayed in the lower right corner of the window:
Deleting Current Users
- Highlight the user name and click Delete Current User button. Deleting the current user removes the user from the list of active users of the MicroKernel and terminates the user's connection to the Communications Server. All open files for the user are closed and all allocated resources are freed.
- You can also click Delete All Users which deletes all of the current MicroKernel users.
Viewing MicroKernel Resource Usage
- Choose Resource Usage from the MicroKernel menu. The MicroKernel Resource Usage dialog box appears, as shown in Figure 11-6 .
Figure 11-6 MicroKernel Resource Usage Dialog Box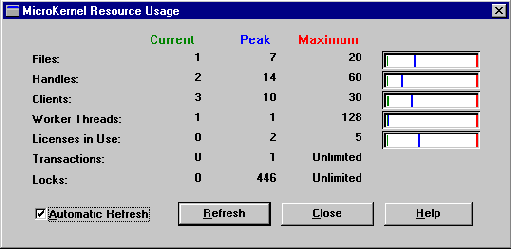
This dialog box allows you to view the total resources in use by the MicroKernel since it was loaded.The MicroKernel Resource Usage dialog box shows the following statistics for each resource:
Note
The maximum values for most of these parameters are controlled dynamically by the engine. The maximum value is shown for backwards compatibility purposes only.
Viewing MicroKernel Communications Statistics
- Choose Communications from the MicroKernel menu. The MicroKernel Communications Statistics dialog box appears, as shown in Figure 11-7. This dialog box shows you the network requests, worker threads, and sessions in use by the Communications Server since it was loaded.
Figure 11-7 MicroKernel Communications Statistics Dialog Box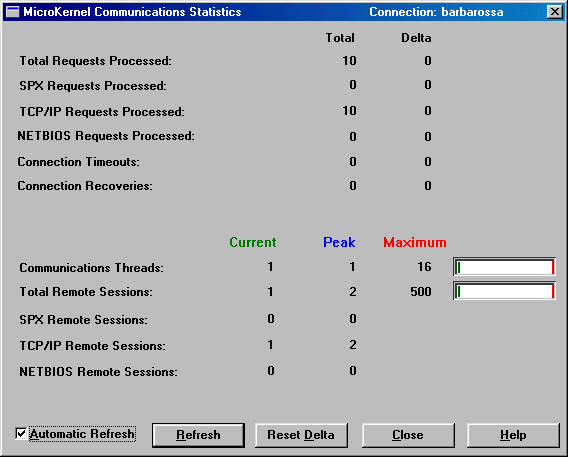
The MicroKernel Communications Statistics dialog box shows the following statistics for several of the communications resources:
- Current - Shows the most recent value for each field.
- Peak - Shows the highest value for the field since the Communications Manager was started.
- Maximum - Shows the highest value allowed for the field.
You can monitor the activity of the following communications resources in the MicroKernel Communications Statistics dialog box:
Total - Indicates the number of requests processed since the Communications server was loaded.
Delta - Indicates the number of requests since you first invoked the Communications Statistics dialog box. To reset this number to zero, click Reset Delta.
Total - Indicates the number of requests processed since the Communications server was loaded.
Delta - Indicates the number of requests since you first invoked the Communications Statistics dialog box. To reset this number to zero, click Reset Delta.
Total - Indicates the number of requests processed since the Communications server was loaded.
Delta - Indicates the number of requests since you first invoked the Communications Statistics dialog box. To reset this number to zero, click Reset Delta.
Total - Indicates the number of requests processed since the Communications server was loaded.
Delta - Indicates the number of requests since you first invoked the Communications Statistics dialog box. To reset this number to zero, click Reset Delta.
Delta - Indicates the number of requests since you first invoked the Communications Statistics dialog box. To reset this number to zero, click Reset Delta.
Delta - Indicates the number of requests since you first invoked the Communications Statistics dialog box. To reset this number to zero, click Reset Delta.
Worker threads are also used to process Monitor utility requests, so you may not see the number of current worker threads drop below one. This is normal.
| Prev Setting Monitor Utility Options |
Contents Up Check for Revisions | Next Monitoring SQL Interface Resources |